Search result
SUMMARY

TISSUE
BRAIN
SINGLE CELL
TISSUE CELL
PATHOLOGY
DISEASE
IMMUNE
BLOOD

SUBCELL
CELL LINE
STRUCTURE
|
TISSUE
PRIMARY DATA
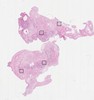
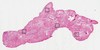
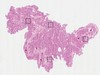
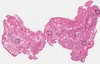
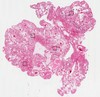
FALLOPIAN TUBE

ANTIBODIES
AND VALIDATION 
Dictionary
Fallopian tube
Tissue proteome
Fallopian tube
|
|
||||||||||||||||||||||||||||||||||||||||||||||||||||||||||||||||||||||||||||||||||||||||||
The Project
The Human Protein Atlas
 The Human Protein Atlas project is funded