We use cookies to enhance the usability of our website. If you continue, we'll assume that you are happy to receive all cookies. More information. Don't show this again.
B2M
SECTIONS
  • TISSUE
  • BRAIN
  • SINGLE CELL TYPE
  • TISSUE CELL TYPE
  • PATHOLOGY
  • DISEASE
  • IMMUNE CELL
  • BLOOD PROTEIN
  • SUBCELLULAR
  • CELL LINE
  • STRUCTURE
  • METABOLIC
ABOUT
  • INTRODUCTION
  • HISTORY
  • ORGANIZATION
  • PUBLICATIONS
  • ANTIBODY SUBMISSION
  • ANTIBODY AVAILABILITY
  • ACKNOWLEDGMENTS
  • CONTACT
NEWS
  • NEWS ARTICLES
  • PRESS ROOM
LEARN
  • DICTIONARY
  • PROTEIN CLASSES
  • PROTEIN EVIDENCE
  • METHODS
  • EDUCATIONAL VIDEOS
DATA
  • DOWNLOADABLE DATA
  • PUBLICATION DATA
  • RELEASE HISTORY
  • SARS-COV-2
HELP
  • ANTIBODY VALIDATION
  • ASSAYS & ANNOTATION
  • DISCLAIMER
  • HELP & FAQ
  • PRIVACY STATEMENT
  • LICENCE & CITATION
Fields »
Search result

Field
Term
Gene name
Class
Subclass
Class
Keyword
Chromosome
External id
Tissue
Cell type
Expression
Patient ID
Tissue
Category
Cluster
Reliability
Brain region
Category
Brain region
Category
Brain region
Category
Reliability
Cell type
Category
Cluster
Tissue
Cell type
Enrichment
Cancer
Prognosis
Cancer
Category
Cell type
Category
Cell lineage
Category
Cluster
Annotation
Disease
Location
Searches
Location
Cell line
Type
Phase
Reliability
Cancer type
Category
Cluster
Pathway
Category
Score
Score
Score
Validation
Validation
Validation
Validation
Antibodies
Protein structure
In atlas
Column


  • SUMMARY

  • TISSUE

  • BRAIN

  • SINGLE CELL

  • TISSUE CELL

  • PATHOLOGY

  • DISEASE

  • IMMUNE

  • BLOOD

  • SUBCELL

  • CELL LINE

  • STRUCTURE

  • METABOLIC

  • B2M
TISSUE PRIMARY DATA WHITE MATTER Show tissue menu
ADIPOSE TISSUE ADRENAL GLAND AMYGDALA APPENDIX BASAL GANGLIA BONE MARROW BREAST BRONCHUS CEREBELLUM CEREBRAL CORTEX CERVIX CHOROID PLEXUS COLON DUODENUM ENDOMETRIUM
EPIDIDYMIS ESOPHAGUS FALLOPIAN TUBE GALLBLADDER HEART MUSCLE HIPPOCAMPAL FORMATION HYPOTHALAMUS KIDNEY LIVER LUNG LYMPH NODE MEDULLA OBLONGATA MIDBRAIN NASOPHARYNX ORAL MUCOSA
OVARY PANCREAS PARATHYROID GLAND PITUITARY GLAND PLACENTA PONS PROSTATE RECTUM RETINA SALIVARY GLAND SEMINAL VESICLE SKELETAL MUSCLE SKIN SMALL INTESTINE SMOOTH MUSCLE
SOFT TISSUE SPINAL CORD SPLEEN STOMACH TESTIS THALAMUS THYMUS THYROID GLAND TONGUE TONSIL URINARY BLADDER VAGINA WHITE MATTER
ANTIBODIES
AND
VALIDATION
Dictionary
Tissue proteome
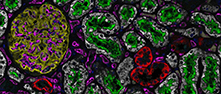
WHITE MATTER - Expression summary
Protein profiling
Multiplex tissuei

A summary of the protein localization in the current human tissue based on multiplex immunohistochemistry profiling in selected tissues is shown for genes where this analysis has been performed.

Protein expressioni

On the top, protein expression in current human tissue, based on all annotated cell types, is reported with the units not detected (n), low (l), medium (m) and high (h). Underneath, protein expression in each annotated cell type are reported using the same units.

Protein expression data is based on knowledge-based annotation. For genes where more than one antibody has been used, a collective score is set.

If knowledge-based annotation could not be performed for a gene, no data is displayed here. View antibody staining data further down this page.

Read more
No data
RNA expressioni

A summary of mRNA expression data available for current tissue based on several datasets. The mRNA expression levels in human tissues are based on RNA-seq data generated by the Human Protein Atlas (HPA), Genotype-Tissue Expression (GTEx) portal and CAGE data generated by the FANTOM5 consortium. Consensus normalized expression levels for human tissues was created by combining the data from HPA and GTEx datasets.

The mRNA expression levels in pig are based on RNA-seq data generated by the Human Protein Atlas (HPA), and for mouse, HPA data and in situ hybridization generated by the Allen brain atlas are reported.

Scroll down to view mRNA expression data in more detail.
Read more
Consensus:909.5 nTPM
HPA:909.5 nTPM
FANTOM5:1169.7 Scaled Tags Per Million
Pig:176.8 nTPM
Mouse:517.6 nTPM

WHITE MATTER - HPA Brain RNA-seq
Max nTPM 909.5
Sample id Sample description nTPM
Angular gyrus (white matter)
nTPM: 698.1
1920 Male, age 76, both hemispheres 698.1
Anterior funiculus (white matter)
nTPM: 829.5
2818 Female, age 79, both hemispheres 866.2
2193 Male, age 75, both hemispheres 849.7
2734 Male, age 80, both hemispheres 809.2
2819 Male, age 47, both hemispheres 792.6
Area striata (white matter)
nTPM: 629.7
2258 Female, age 91, left hemisphere 629.7
Cerebellar white matter
nTPM: 775.0
1837 Male, age 76, left hemisphere 841.5
2105 Male, age 74, right hemisphere 832.5
1864 Male, age 80, left hemisphere 774.1
1931 Female, age 91, left hemisphere 745.5
2174 Male, age 61, right hemisphere 743.5
2773 Female, age 85, right hemisphere 712.8
Corpus callosum, genu (white matter)
nTPM: 734.7
2771 Male, age 75, left hemisphere 853.4
1885 Female, age 94, left hemisphere 733.2
1887 Male, age 76, left hemisphere 731.3
1934 Male, age 61, right hemisphere 709.7
1849 Female, age 91, right hemisphere 699.4
1886 Female, age 67, right hemisphere 681.4
Corpus callosum, splenium (white matter)
nTPM: 752.4
2104 Male, age 75, left hemisphere 826.4
2847 Female, age 67, right hemisphere 774.6
1946 Male, age 76, left hemisphere 736.3
2238 Female, age 94, right hemisphere 672.4
Dorsal funiculus (white matter)
nTPM: 835.3
2128 Male, age 75, both hemispheres 934.6
2817 Male, age 47, both hemispheres 834.7
2064 Female, age 79, both hemispheres 822.6
2812 Male, age 66, both hemispheres 795.4
2810 Male, age 90, both hemispheres 789.1
Lateral funiculus (white matter)
nTPM: 909.5
2294 Male, age 66, both hemispheres 1062.6
2192 Male, age 75, both hemispheres 920.7
2094 Female, age 79, both hemispheres 836.1
2099 Male, age 90, both hemispheres 818.5
Occipital cortex (white matter)
nTPM: 641.5
2259 Male, age 75, midline 684.8
2257 Female, age 67, both hemispheres 598.3
Parahippocampal cortex (white matter)
nTPM: 642.8
2157 Female, age 91, both hemispheres 642.8
Parieto-temporal junction (white matter)
nTPM: 651.8
2121 Male, age 76, left hemisphere 691.2
1935 Female, age 94, right hemisphere 675.6
1999 Female, age 67, right hemisphere 671.4
2770 Female, age 91, right hemisphere 627.7
2774 Male, age 61, right hemisphere 627.6
2469 Male, age 75, right hemisphere 617.1
Somatomor cortex, precentral gyrus (white matter)
nTPM: 583.2
2439 Male, age 75, right hemisphere 583.2
Somatosensory cortex, postcentral gyrus, ventral (white matter)
nTPM: 593.2
2623 Male, age 75, right hemisphere 593.2
Temporal white matter
nTPM: 679.0
1801 Male, age 76, left hemisphere 733.8
2524 Female, age 85, left hemisphere 696.4
2736 Female, age 91, right hemisphere 680.0
2523 Female, age 94, left hemisphere 649.5
2254 Male, age 75, right hemisphere 635.1

WHITE MATTER - FANTOM5 CAGEi

RNA expression in human tissues obtained through Cap Analysis of Gene Expression (CAGE) generated by the FANTOM5 project are reported as Scaled Tags Per Million.

Read more
Max Scaled Tags Per Million 1169.7
FANTOM5 sample id Sample description Scaled Tags Per Million
Corpus callosum
Scaled Tags Per Million: 1169.7
FF:10042-101F6 24-68 years, mixed 1169.7

WHITE MATTER - Pig RNA-seqi

RNA-seq data obtained from pig brain is reported as nTPM .

Normal distribution across the dataset is visualized with box plots, shown as median and 25th and 75th percentiles. Points are displayed as outliers if they are above or below 1.5 times the interquartile range. nTPM values of the individual samples are presented next to the box plot.
Read more
Average nTPM 176.8
Pig sample Sample description nTPM
Corpus callosum
nTPM: 176.8
Samples: 4

Max nTPM: 198.3
Min nTPM: 143.3
Sample A Female 143.3
Sample B Female 198.3
Sample C Male 168.9
Sample D Male 196.6

WHITE MATTER - Mouse RNA-seqi

RNA-seq data obtained from mouse brain is reported as nTPM .

Normal distribution across the dataset is visualized with box plots, shown as median and 25th and 75th percentiles. Points are displayed as outliers if they are above or below 1.5 times the interquartile range. nTPM values of the individual samples are presented next to the box plot.
Read more
Average nTPM 517.6
Mouse sample Sample description nTPM
Corpus callosum
nTPM: 517.6
Samples: 3

Max nTPM: 654.0
Min nTPM: 398.6
Sample A Male 398.6
Sample B Male 654.0
Sample D Female 500.1

Contact

  • NEWS ARTICLES
  • PRESS ROOM
  • contact@proteinatlas.org

The Project

  • INTRODUCTION
  • ORGANIZATION
  • PUBLICATIONS

The Human Protein Atlas

  • DOWNLOADABLE DATA
  • LICENCE & CITATION
  • HELP & FAQ
The Human Protein Atlas project is funded
by the Knut & Alice Wallenberg Foundation.