We use cookies to enhance the usability of our website. If you continue, we'll assume that you are happy to receive all cookies. More information. Don't show this again.
DRC3
SECTIONS
  • TISSUE
  • BRAIN
  • SINGLE CELL TYPE
  • TISSUE CELL TYPE
  • PATHOLOGY
  • DISEASE
  • IMMUNE CELL
  • BLOOD PROTEIN
  • SUBCELLULAR
  • CELL LINE
  • STRUCTURE
  • METABOLIC
ABOUT
  • INTRODUCTION
  • HISTORY
  • ORGANIZATION
  • PUBLICATIONS
  • ANTIBODY SUBMISSION
  • ANTIBODY AVAILABILITY
  • ACKNOWLEDGMENTS
  • CONTACT
NEWS
  • NEWS ARTICLES
  • PRESS ROOM
LEARN
  • DICTIONARY
  • PROTEIN CLASSES
  • PROTEIN EVIDENCE
  • METHODS
  • EDUCATIONAL VIDEOS
DATA
  • DOWNLOADABLE DATA
  • PUBLICATION DATA
  • RELEASE HISTORY
  • SARS-COV-2
HELP
  • ANTIBODY VALIDATION
  • ASSAYS & ANNOTATION
  • DISCLAIMER
  • HELP & FAQ
  • PRIVACY STATEMENT
  • LICENCE & CITATION
Fields »
Search result

Field
Term
Gene name
Class
Subclass
Class
Keyword
Chromosome
External id
Tissue
Cell type
Expression
Patient ID
Tissue
Category
Cluster
Reliability
Brain region
Category
Brain region
Category
Brain region
Category
Reliability
Cell type
Category
Cluster
Tissue
Cell type
Enrichment
Cancer
Prognosis
Cancer
Category
Cell type
Category
Cell lineage
Category
Cluster
Annotation
Disease
Location
Searches
Location
Cell line
Type
Phase
Reliability
Cancer type
Category
Cluster
Pathway
Category
Score
Score
Score
Validation
Validation
Validation
Validation
Antibodies
Protein structure
In atlas
Column


  • SUMMARY

  • TISSUE

  • BRAIN

  • SINGLE CELL

  • TISSUE CELL

  • PATHOLOGY

  • DISEASE

  • IMMUNE

  • BLOOD

  • SUBCELL

  • CELL LINE

  • STRUCTURE

  • METABOLIC

  • DRC3
PROTEIN STRUCTURE
ANTIBODIES
AND
VALIDATION
Protein structures
GENERAL INFORMATIONi

General description of the gene and the encoded protein(s) using information from HGNC and Ensembl, as well as predictions made by the Human Protein Atlas project.

Gene namei

Official gene symbol, which is typically a short form of the gene name, according to HGNC.

DRC3
Synonyms CFAP134, DKFZP586M1120, LRRC48
Gene descriptioni

Full gene name according to HGNC.

Dynein regulatory complex subunit 3
Predicted locationi

All transcripts of all genes have been analyzed regarding the location(s) of corresponding protein based on prediction methods for signal peptides and transmembrane regions.

  • Genes with at least one transcript predicted to encode a secreted protein, according to prediction methods or to UniProt location data, have been further annotated and classified with the aim to determine if the corresponding protein(s) are secreted or actually retained in intracellular locations or membrane-attached.

  • Remaining genes, with no transcript predicted to encode a secreted protein, will be assigned the prediction-based location(s).

The annotated location overrules the predicted location, so that a gene encoding a predicted secreted protein that has been annotated as intracellular will have intracellular as the final location.

Read more
Intracellular
Protein evidence Evidence at protein level (all genes)
GENE INFORMATIONi

Gene information from Ensembl and Entrez, as well as links to available gene identifiers are displayed here. Information was retrieved from Ensembl if not indicated otherwise.

Chromosome 17
Cytoband p11.2
Chromosome location (bp) 17972813 - 18016889
Number of transcriptsi

Number of protein-coding transcripts from the gene as defined by Ensembl.

10
Ensembl ENSG00000171962 (version 103.38)
Entrez gene 83450
HGNC HGNC:25384
UniProt Q9H069 (UniProt - Evidence at protein level)
neXtProt NX_Q9H069
Antibodypedia DRC3 antibodies


PROTEIN STRUCTUREi

The Structure section provides predicted structures from the Alphafold protein structure database and available experimental structures from Protein Data Bank (PDB).

In the Structure drop-down menu all experimental structures from PDB are available for selection and display. The structures are displayed using the NGL Viewer and can be zoomed-in and rotated either manually or by checking the Autorotate box. The Color scheme can be selected to show the residue index, chain name or confidence score (as B-factors and pLDDT score for experimental and predicted structures, respectively). The positions for available antigen sequences in the structure are shown if Antigens is turned to ON, and the Variants slider can be used to show the positions of clinical and population variants.https://github.com/nglviewer/ngl

Read more

Predicted


Description: Structure prediction from Alphafold project. Structure version 2

# Chains: 1      # Clinical variants: 0      # Population variants: 372

Antigens:

Off
On

Variants:

Off
Clinical
Population

Color scheme:

Confidence
Residue index
Chain name

Autorotate:

Off
On


PROTEIN BROWSERi

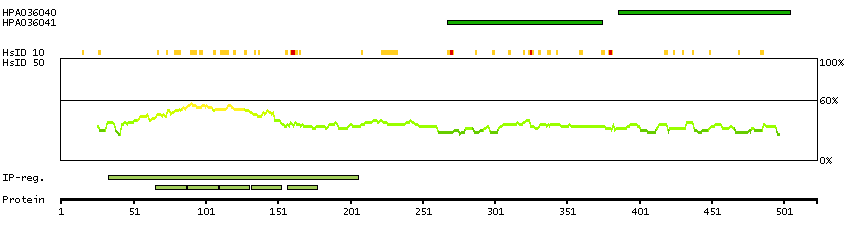
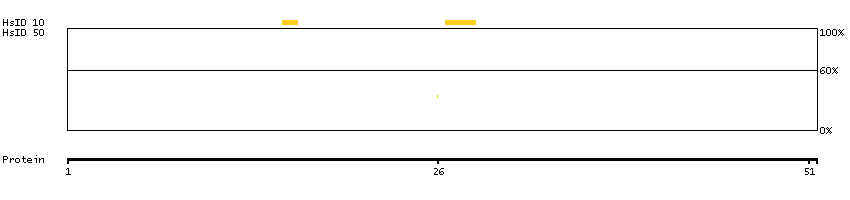
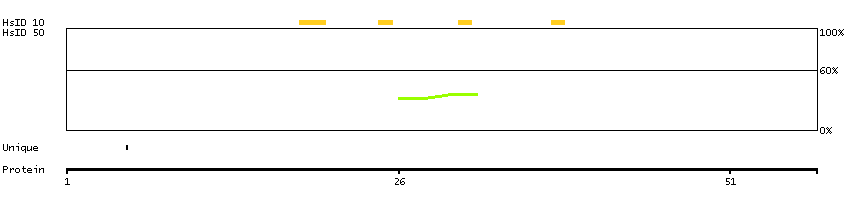
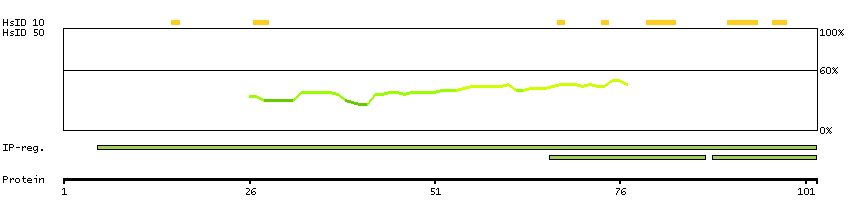
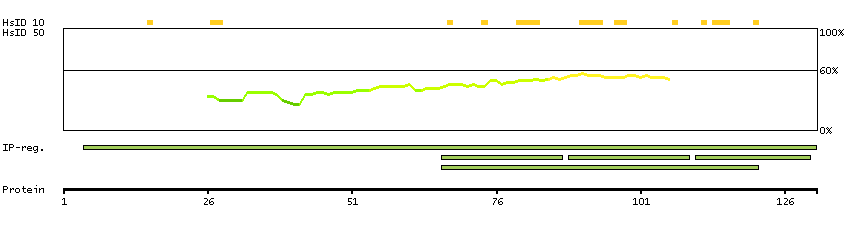
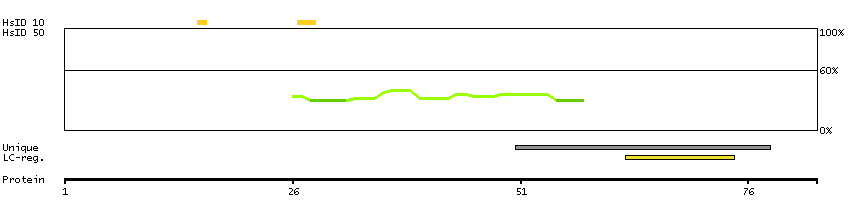
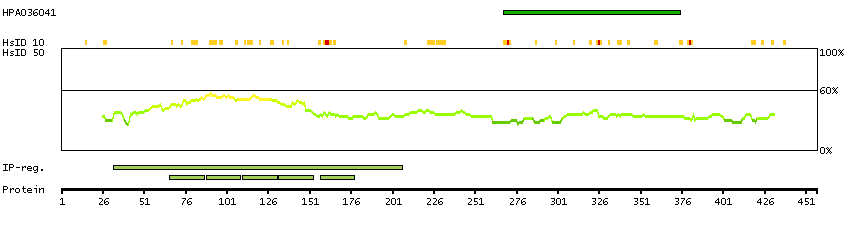
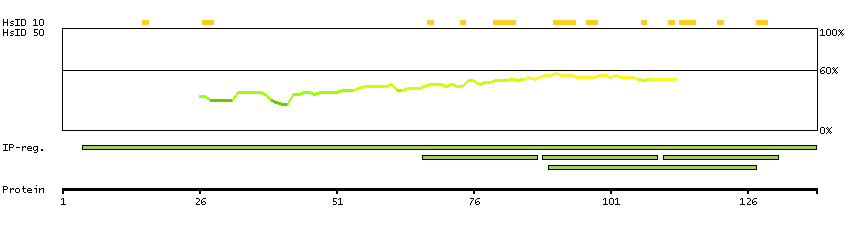
The protein browser displays the antigen location on the target protein(s) and the features of the target protein. The tabs at the top of the protein view section can be used to switch between the different splice variants to which an antigen has been mapped.

At the top of the view, the position of the antigen (identified by the corresponding HPA identifier) is shown as a green bar. A yellow triangle on the bar indicates a <100% sequence identity to the protein target.

Below the antigens, the maximum percent sequence identity of the protein to all other proteins from other human genes is displayed, using a sliding window of 10 aa residues (HsID 10) or 50 aa residues (HsID 50). The region with the lowest possible identity is always selected for antigen design, with a maximum identity of 60% allowed for designing a single-target antigen (read more).

The curve in blue displays the predicted antigenicity i.e. the tendency for different regions of the protein to generate an immune response, with peak regions being predicted to be more antigenic.The curve shows average values based on a sliding window approach using an in-house propensity scale. (read more).

If a signal peptide is predicted by a majority of the signal peptide predictors SPOCTOPUS, SignalP 4.0, and Phobius (turquoise) and/or transmembrane regions (orange) are predicted by MDM, these are displayed.

Low complexity regions are shown in yellow and InterPro regions in green. Common (purple) and unique (grey) regions between different splice variants of the gene are also displayed (read more), and at the bottom of the protein view is the protein scale.
DRC3-201
DRC3-202
DRC3-203
DRC3-205
DRC3-210
DRC3-211
DRC3-212
DRC3-213
DRC3-216
DRC3-218


PROTEIN INFORMATIONi

The protein information section displays alternative protein-coding transcripts (splice variants) encoded by this gene according to the Ensembl database.

The ENSP identifier links to the Ensembl website protein summary, while the ENST identifier links to the Ensembl website transcript summary for the selected splice variant. The data in the UniProt column can be expanded to show links to all matching UniProt identifiers for this protein.

The protein classes assigned to this protein are shown if expanding the data in the protein class column. Parent protein classes are in bold font and subclasses are listed under the parent class.

The Gene Ontology terms assigned to this protein are listed if expanding the Gene ontology column. The length of the protein (amino acid residues according to Ensembl), molecular mass (kDalton), predicted signal peptide (according to a majority of the signal peptide predictors SPOCTOPUS, SignalP 4.0, and Phobius) and the number of predicted transmembrane region(s) (according to MDM) are also reported.
Splice variant UniProt Protein class Gene ontology Length & mass Signal peptide
(predicted)
Transmembrane regions
(predicted)
DRC3-201
ENSP00000326870
ENST00000313838
Q9H069 [Direct mapping]
Dynein regulatory complex subunit 3
Show all
Predicted intracellular proteins
   Intracellular proteins predicted by MDM and MDSEC
Mapped to neXtProt
   neXtProt - Evidence at protein level
Show all
GO:0005515 [protein binding]
GO:0005737 [cytoplasm]
GO:0005856 [cytoskeleton]
GO:0005929 [cilium]
GO:0005930 [axoneme]
GO:0031514 [motile cilium]
GO:0042995 [cell projection]
Show all
523 aa
61.1 kDa
No 0
DRC3-202
ENSP00000382136
ENST00000399182
Q9H069 [Direct mapping]
Dynein regulatory complex subunit 3
Show all
Predicted intracellular proteins
   Intracellular proteins predicted by MDM and MDSEC
Mapped to neXtProt
   neXtProt - Evidence at protein level
Show all
GO:0005515 [protein binding]
GO:0005737 [cytoplasm]
GO:0005856 [cytoskeleton]
GO:0005929 [cilium]
GO:0005930 [axoneme]
GO:0031514 [motile cilium]
GO:0042995 [cell projection]
Show all
457 aa
53.2 kDa
No 0
DRC3-203
ENSP00000382140
ENST00000399187
Q9H069 [Direct mapping]
Dynein regulatory complex subunit 3
Show all
Predicted intracellular proteins
   Intracellular proteins predicted by MDM and MDSEC
Mapped to neXtProt
   neXtProt - Evidence at protein level
Show all
GO:0005515 [protein binding]
GO:0005737 [cytoplasm]
GO:0005856 [cytoskeleton]
GO:0005929 [cilium]
GO:0005930 [axoneme]
GO:0031514 [motile cilium]
GO:0042995 [cell projection]
Show all
523 aa
61.1 kDa
No 0
DRC3-205
ENSP00000464150
ENST00000479684
J3QRC9 [Direct mapping]
Dynein regulatory complex subunit 3
Show all
Predicted intracellular proteins
   Intracellular proteins predicted by MDM and MDSEC
Show all
51 aa
5.6 kDa
No 0
DRC3-210
ENSP00000465314
ENST00000579376
K7EJT6 [Direct mapping]
Dynein regulatory complex subunit 3
Show all
Predicted intracellular proteins
   Intracellular proteins predicted by MDM and MDSEC
Show all
57 aa
6.5 kDa
No 0
DRC3-211
ENSP00000464476
ENST00000579977
J3QS14 [Direct mapping]
Dynein regulatory complex subunit 3
Show all
Predicted intracellular proteins
   Intracellular proteins predicted by MDM and MDSEC
Show all
GO:0005515 [protein binding]
Show all
102 aa
11.8 kDa
No 0
DRC3-212
ENSP00000461917
ENST00000581264
J3KRB8 [Direct mapping]
Dynein regulatory complex subunit 3
Show all
Predicted intracellular proteins
   Intracellular proteins predicted by MDM and MDSEC
Show all
GO:0005515 [protein binding]
Show all
131 aa
15 kDa
No 0
DRC3-213
ENSP00000464676
ENST00000582416
J3QSG4 [Direct mapping]
Dynein regulatory complex subunit 3
Show all
Predicted intracellular proteins
   Intracellular proteins predicted by MDM and MDSEC
Show all
83 aa
9.5 kDa
No 0
DRC3-216
ENSP00000462661
ENST00000584166
Q9H069 [Direct mapping]
Dynein regulatory complex subunit 3
Show all
Predicted intracellular proteins
   Intracellular proteins predicted by MDM and MDSEC
Mapped to neXtProt
   neXtProt - Evidence at protein level
Show all
GO:0005515 [protein binding]
GO:0005737 [cytoplasm]
GO:0005856 [cytoskeleton]
GO:0005929 [cilium]
GO:0005930 [axoneme]
GO:0031514 [motile cilium]
GO:0042995 [cell projection]
Show all
457 aa
53.2 kDa
No 0
DRC3-218
ENSP00000464224
ENST00000585108
J3QRH8 [Direct mapping]
Dynein regulatory complex subunit 3
Show all
Predicted intracellular proteins
   Intracellular proteins predicted by MDM and MDSEC
Show all
GO:0005515 [protein binding]
Show all
138 aa
15.8 kDa
No 0

Contact

  • NEWS ARTICLES
  • PRESS ROOM
  • contact@proteinatlas.org

The Project

  • INTRODUCTION
  • ORGANIZATION
  • PUBLICATIONS

The Human Protein Atlas

  • DOWNLOADABLE DATA
  • LICENCE & CITATION
  • HELP & FAQ
The Human Protein Atlas project is funded
by the Knut & Alice Wallenberg Foundation.