We use cookies to enhance the usability of our website. If you continue, we'll assume that you are happy to receive all cookies. More information. Don't show this again.
A summary of the protein localization in the current human tissue based on multiplex immunohistochemistry profiling in selected tissues is shown for genes where this analysis has been performed.
Protein expressioni
On the top, protein expression in current human tissue, based on all annotated cell types, is reported with the units not detected (n), low (l), medium (m) and high (h). Underneath, protein expression in each annotated cell type are reported using the same units.
Protein expression data is based on knowledge-based annotation. For genes where more than one antibody has been used, a collective score is set.
If knowledge-based annotation could not be performed for a gene, no data is displayed here. View antibody staining data further down this page.
A summary of mRNA expression data available for current tissue based on several datasets. The mRNA expression levels in human tissues are based on RNA-seq data generated by the Human Protein Atlas (HPA), Genotype-Tissue Expression (GTEx) portal and CAGE data generated by the FANTOM5 consortium. Consensus normalized expression levels for human tissues was created by combining the data from HPA and GTEx datasets.
The mRNA expression levels in pig are based on RNA-seq data generated by the Human Protein Atlas (HPA), and for mouse, HPA data and in situ hybridization generated by the Allen brain atlas are reported.
Scroll down to view mRNA expression data in more detail.
The RNA-seq details section shows detailed information about the individual samples used for the transcript profiling and results of the RNA-seq analysis.
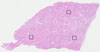
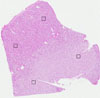
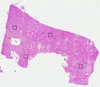
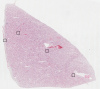
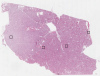
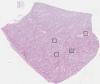
Information about each individual sample is listed below, including gender, age, a tissue section image and estimated fractions of cell types. nTPM (normalized transcripts per million) values give a quantification of the gene abundance which is comparable between different genes and samples.
RNA-Seq data generated by the Genotype-Tissue Expression (GTEx) project from human tissues is reported as mean nTPM. More information can be found on the GTEx portal.
Distribution across the dataset is visualized with box plots, shown as median and 25th and 75th percentiles. Points are displayed as outliers if they are above or below 1.5 times the interquartile range. nTPM values of the individual samples are presented next to the box plot.
Max nTPM: 1710.2
Min nTPM: 533.1
Std nTPM: 266.1
Median nTPM: 855.6
GTEX-11TTK-1926-SM-5PNW8
60-69 years, female
1710.2
GTEX-13NYB-1726-SM-5N9G2
40-49 years, male
1698.8
GTEX-1JMPZ-1226-SM-ARU8Y
30-39 years, male
1548.6
GTEX-1PWST-2226-SM-EVR3G
70-79 years, male
1539.8
GTEX-NPJ8-2226-SM-3TW8D
40-49 years, male
1476.5
GTEX-1JMQJ-1726-SM-E9U4V
50-59 years, male
1453.8
GTEX-T6MN-1826-SM-EXOHN
50-59 years, male
1436.5
GTEX-14E6D-2526-SM-5YYA9
50-59 years, male
1422.5
GTEX-11OF3-1326-SM-5N9FJ
60-69 years, male
1308.9
GTEX-13RTJ-2226-SM-5S2Q1
60-69 years, male
1284.9
GTEX-1CB4J-1926-SM-7MGX8
60-69 years, male
1270.7
GTEX-1C6VQ-2326-SM-7IGN1
50-59 years, male
1247.8
GTEX-1JMQK-1926-SM-CJI3B
60-69 years, male
1213.0
GTEX-14C5O-2026-SM-5YYB1
60-69 years, male
1195.3
GTEX-T5JC-1526-SM-4DM68
20-29 years, male
1171.2
GTEX-1N2DW-1826-SM-EAZ54
50-59 years, male
1168.4
GTEX-1QP6S-1526-SM-EXUSG
40-49 years, male
1165.1
GTEX-15CHQ-2126-SM-6871M
60-69 years, male
1151.8
GTEX-1NV8Z-2226-SM-EXOJ2
60-69 years, male
1089.1
GTEX-17F97-1926-SM-7IGM4
50-59 years, male
1027.4
GTEX-1J1OQ-1426-SM-AHZ3P
40-49 years, female
1020.6
GTEX-1399S-0526-SM-5IJG8
30-39 years, female
1016.4
GTEX-ZDXO-0226-SM-4WKH7
60-69 years, male
1012.5
GTEX-1HB9E-1826-SM-D4P33
50-59 years, male
992.2
GTEX-1R9PO-1626-SM-E6CPT
60-69 years, female
987.5
GTEX-1GTWX-1826-SM-9QEHG
60-69 years, male
985.3
GTEX-O5YV-1226-SM-EV795
60-69 years, female
982.8
GTEX-17HHY-2326-SM-7KFSR
50-59 years, male
962.5
GTEX-1GF9W-1326-SM-7P8PX
60-69 years, male
960.0
GTEX-1KWVE-0826-SM-CXZKO
30-39 years, male
956.5
GTEX-ZYT6-2226-SM-5GIC9
30-39 years, male
946.3
GTEX-QDT8-1726-SM-EYYV6
30-39 years, female
944.4
GTEX-17F96-1926-SM-7MGWY
70-79 years, male
939.9
GTEX-QDVN-1626-SM-48TZC
50-59 years, male
921.8
GTEX-1F48J-2226-SM-7MXTN
50-59 years, female
914.7
GTEX-16MT8-1926-SM-7EPGL
60-69 years, female
906.5
GTEX-1BAJH-1826-SM-731DA
70-79 years, male
903.0
GTEX-1GN1U-2126-SM-AHZ4J
50-59 years, female
893.9
GTEX-14C39-2126-SM-664OH
40-49 years, male
886.2
GTEX-1GF9V-1926-SM-9JGHE
60-69 years, male
883.7
GTEX-ZLFU-0926-SM-5P9F8
40-49 years, male
871.8
GTEX-1A3MW-2226-SM-73KUX
60-69 years, female
858.5
GTEX-147F4-2626-SM-5Q5CS
50-59 years, male
855.6
GTEX-13OVI-1126-SM-5KLZF
60-69 years, female
833.7
GTEX-ZE9C-1426-SM-4WKGM
60-69 years, male
829.7
GTEX-1IL2V-1826-SM-ARU7R
70-79 years, male
828.5
GTEX-13OW6-1826-SM-5N9F9
50-59 years, male
823.4
GTEX-1LG7Y-2726-SM-D5OVW
50-59 years, male
822.3
GTEX-1I1GP-1926-SM-CNNQU
50-59 years, male
811.0
GTEX-REY6-1826-SM-EAZAT
60-69 years, male
805.4
GTEX-13112-2126-SM-5GCO4
50-59 years, male
801.6
GTEX-13OVL-1826-SM-5KLZR
50-59 years, male
800.8
GTEX-1EKGG-2226-SM-7IGOA
60-69 years, male
795.7
GTEX-1HBPI-2026-SM-CE6RZ
50-59 years, male
793.9
GTEX-13O1R-2526-SM-5N9FW
60-69 years, male
780.9
GTEX-145MN-0326-SM-5QGQI
30-39 years, male
780.8
GTEX-P4QS-1126-SM-3NMD5
60-69 years, male
773.9
GTEX-1A8FM-2026-SM-7P8RN
50-59 years, female
767.9
GTEX-1IKK5-0926-SM-A9G2U
60-69 years, male
767.8
GTEX-1MUQO-2526-SM-E9TJN
60-69 years, male
760.8
GTEX-QLQW-1626-SM-CMKFE
30-39 years, male
760.1
GTEX-1E2YA-1626-SM-7MGXS
50-59 years, male
757.0
GTEX-15DYW-2026-SM-6AJBD
60-69 years, female
748.8
GTEX-1H3NZ-2126-SM-9WPQ6
60-69 years, male
737.3
GTEX-XPVG-0526-SM-4B65N
50-59 years, male
732.5
GTEX-ZYFG-1626-SM-5GZYY
60-69 years, female
709.2
GTEX-ZVZP-0926-SM-5GIDB
50-59 years, male
708.9
GTEX-RN64-1626-SM-48FD7
50-59 years, male
705.2
GTEX-Y5V6-2026-SM-5IFHO
60-69 years, male
698.4
GTEX-1N2EF-1426-SM-EXUSH
60-69 years, male
693.8
GTEX-1GMR3-2426-SM-7MXV2
40-49 years, male
687.4
GTEX-ZC5H-1726-SM-5HL7X
40-49 years, female
670.6
GTEX-11GS4-2326-SM-5A5KS
60-69 years, male
670.1
GTEX-1AX8Z-2326-SM-731CR
60-69 years, male
666.0
GTEX-12696-0926-SM-5FQTV
60-69 years, male
657.5
GTEX-1OJC4-2326-SM-DTXA5
50-59 years, female
654.4
GTEX-1JMLX-1526-SM-AHZ3N
50-59 years, male
651.9
GTEX-Y5V5-1226-SM-EYYVP
60-69 years, female
639.2
GTEX-1H3VY-1926-SM-9JGHJ
50-59 years, male
632.2
GTEX-1497J-0826-SM-5NQAJ
60-69 years, male
630.7
GTEX-1HCU7-1826-SM-A9G2A
50-59 years, male
626.9
GTEX-S33H-1426-SM-EZ6L7
30-39 years, male
622.5
GTEX-1JJ6O-2526-SM-AHZ3J
60-69 years, male
616.1
GTEX-12WSG-0826-SM-5EQ5A
50-59 years, female
581.8
GTEX-1K9T9-1826-SM-CXZK2
50-59 years, female
533.1
Show allShow less
Kidney - Medulla Average nTPM: 808.3
Samples: 4
Max nTPM: 1139.2
Min nTPM: 549.8
Std nTPM: 239.5
Median nTPM: 772.1
GTEX-RU72-1926-SM-EAZ3F
50-59 years, female
1139.2
GTEX-T5JC-1626-SM-EZ6KW
20-29 years, male
931.1
GTEX-R55E-2026-SM-EZ6L1
20-29 years, male
613.0
GTEX-TKQ2-0626-SM-EZ6LB
50-59 years, male
549.8
KIDNEY - FANTOM5 CAGEi
RNA expression in human tissues obtained through Cap Analysis of Gene Expression (CAGE) generated by the FANTOM5 project are reported as Scaled Tags Per Million.
 The Human Protein Atlas project is funded