We use cookies to enhance the usability of our website. If you continue, we'll assume that you are happy to receive all cookies. More information. Don't show this again.
AFMID
SECTIONS
  • TISSUE
  • BRAIN
  • SINGLE CELL TYPE
  • TISSUE CELL TYPE
  • PATHOLOGY
  • DISEASE
  • IMMUNE CELL
  • BLOOD PROTEIN
  • SUBCELLULAR
  • CELL LINE
  • STRUCTURE
  • METABOLIC
ABOUT
  • INTRODUCTION
  • HISTORY
  • ORGANIZATION
  • PUBLICATIONS
  • ANTIBODY SUBMISSION
  • ANTIBODY AVAILABILITY
  • ACKNOWLEDGMENTS
  • CONTACT
NEWS
  • NEWS ARTICLES
  • PRESS ROOM
LEARN
  • DICTIONARY
  • PROTEIN CLASSES
  • PROTEIN EVIDENCE
  • METHODS
  • EDUCATIONAL VIDEOS
DATA
  • DOWNLOADABLE DATA
  • PUBLICATION DATA
  • RELEASE HISTORY
  • SARS-COV-2
HELP
  • ANTIBODY VALIDATION
  • ASSAYS & ANNOTATION
  • DISCLAIMER
  • HELP & FAQ
  • PRIVACY STATEMENT
  • LICENCE & CITATION
Fields »
Search result

Field
Term
Gene name
Class
Subclass
Class
Keyword
Chromosome
External id
Tissue
Cell type
Expression
Patient ID
Tissue
Category
Cluster
Reliability
Brain region
Category
Brain region
Category
Brain region
Category
Reliability
Cell type
Category
Cluster
Tissue
Cell type
Enrichment
Cancer
Prognosis
Cancer
Category
Cell type
Category
Cell lineage
Category
Cluster
Annotation
Disease
Location
Searches
Location
Cell line
Type
Phase
Reliability
Cancer type
Category
Cluster
Pathway
Category
Score
Score
Score
Validation
Validation
Validation
Validation
Antibodies
Protein structure
In atlas
Column


  • SUMMARY

  • TISSUE

  • BRAIN

  • SINGLE CELL

  • TISSUE CELL

  • PATHOLOGY

  • DISEASE

  • IMMUNE

  • BLOOD

  • SUBCELL

  • CELL LINE

  • STRUCTURE

  • METABOLIC

  • AFMID
BRAIN PONS AND MEDULLA Show tissue menu
AMYGDALA BASAL GANGLIA CEREBELLUM CEREBRAL CORTEX HIPPOCAMPAL FORMATION HYPOTHALAMUS MEDULLA OBLONGATA MIDBRAIN
OLFACTORY BULB PITUITARY GLAND PONS RETINA SPINAL CORD THALAMUS WHITE MATTER
ANTIBODIES
AND
VALIDATION
Brain proteome
PONS AND MEDULLA - Expression summary
Protein profiling
Multiplex tissuei

A summary of the protein localization in the current human tissue based on multiplex immunohistochemistry profiling in selected tissues is shown for genes where this analysis has been performed.
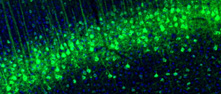
Protein expressioni

On the top, protein expression in current human tissue, based on all annotated cell types, is reported with the units not detected (n), low (l), medium (m) and high (h). Underneath, protein expression in each annotated cell type are reported using the same units.

Protein expression data is based on knowledge-based annotation. For genes where more than one antibody has been used, a collective score is set.

If knowledge-based annotation could not be performed for a gene, no data is displayed here. View antibody staining data further down this page.

Read more
No data
RNA expressioni

A summary of mRNA expression data available for current tissue based on several datasets. The mRNA expression levels in human tissues are based on RNA-seq data generated by the Human Protein Atlas (HPA), Genotype-Tissue Expression (GTEx) portal and CAGE data generated by the FANTOM5 consortium. Consensus normalized expression levels for human tissues was created by combining the data from HPA and GTEx datasets.

The mRNA expression levels in pig are based on RNA-seq data generated by the Human Protein Atlas (HPA), and for mouse, HPA data and in situ hybridization generated by the Allen brain atlas are reported.

Scroll down to view mRNA expression data in more detail.
Read more
Consensus:74.4 nTPM
HPA:74.4 nTPM
FANTOM5:84.6 Scaled Tags Per Million
Pig:4.4 nTPM
Mouse:2.1 nTPM

PONS AND MEDULLA - HPA Brain RNA-seq
Max nTPM 74.4
Sample id Sample description nTPM
Anterior cochlear nucleus, ventral
nTPM: 66.1
2090 Male, age 80, both hemispheres 76.1
2188 Female, age 91, both hemispheres 67.7
2301 Female, age 85, both hemispheres 64.0
1984 Male, age 76, both hemispheres 56.6
Area postrema
nTPM: 58.0
2306 Male, age 80, both hemispheres 72.3
2799 Male, age 61, both hemispheres 54.3
2054 Male, age 76, both hemispheres 47.3
Cuneate nuclei
nTPM: 63.8
2381 Male, age 80, both hemispheres 70.0
2376 Male, age 61, both hemispheres 66.5
2131 Male, age 76, both hemispheres 54.9
Dorsal cochlear nucleus
nTPM: 60.1
2802 Male, age 74, right hemisphere 68.5
2187 Female, age 91, both hemispheres 62.4
2378 Male, age 80, both hemispheres 59.6
2058 Male, age 76, both hemispheres 55.4
2370 Male, age 61, both hemispheres 54.8
Dorsal medullary reticular nucleus
nTPM: 60.0
2373 Male, age 61, both hemispheres 64.9
2088 Male, age 76, both hemispheres 58.8
2040 Female, age 85, both hemispheres 56.4
Dorsal motor vagal complex
nTPM: 53.3
2185 Male, age 76, both hemispheres 62.0
2643 Male, age 74, both hemispheres 60.0
2807 Female, age 85, both hemispheres 55.1
2000 Male, age 74, unknown 53.8
2133 Female, age 91, both hemispheres 51.3
2797 Male, age 61, both hemispheres 50.8
2813 Female, age 72, unknown 47.6
2844 Male, age 55, unknown 45.4
Dorsal tegmental nucleus
nTPM: 55.2
2326 Male, age 74, both hemispheres 60.3
2083 Male, age 80, both hemispheres 59.1
1936 Male, age 76, left hemisphere 52.7
2358 Male, age 61, both hemispheres 48.6
Dorsolateral tegmental area
nTPM: 57.7
2337 Male, age 61, both hemispheres 68.1
2751 Female, age 85, both hemispheres 66.0
2654 Male, age 80, both hemispheres 56.5
2360 Male, age 74, both hemispheres 51.3
2141 Male, age 76, both hemispheres 46.4
Gigantocellular reticular nuclei, medullary
nTPM: 61.0
2314 Male, age 61, both hemispheres 76.9
2387 Female, age 91, both hemispheres 64.6
1876 Female, age 85, both hemispheres 62.8
2022 Male, age 76, right hemisphere 60.0
2310 Male, age 80, both hemispheres 56.0
2462 Male, age 74, both hemispheres 45.8
Gigantocellular reticular nuclei, pars
nTPM: 57.9
2336 Male, age 61, both hemispheres 62.9
2706 Male, age 80, both hemispheres 60.8
2330 Male, age 80, both hemispheres 60.2
2084 Female, age 85, both hemispheres 57.1
2168 Male, age 76, both hemispheres 48.2
Inferior olive
nTPM: 64.1
2178 Male, age 61, both hemispheres 76.1
2379 Male, age 80, both hemispheres 65.0
2085 Female, age 85, both hemispheres 61.2
2628 Female, age 91, both hemispheres 59.4
2563 Male, age 74, both hemispheres 59.1
Kolliker-Fuse nucleus
nTPM: 57.8
2793 Female, age 91, left hemisphere 73.4
2163 Male, age 80, both hemispheres 55.1
2315 Male, age 76, right hemisphere 45.0
Lateral lemniscal nuclei
nTPM: 56.7
2320 Female, age 91, left hemisphere 67.2
2746 Female, age 85, left hemisphere 56.6
2453 Male, age 74, right hemisphere 56.5
2036 Male, age 80, both hemispheres 52.8
2169 Male, age 76, both hemispheres 50.4
Lateral medullary reticular nucleus
nTPM: 63.5
2374 Male, age 61, both hemispheres 75.6
2852 Male, age 80, both hemispheres 72.4
2305 Male, age 74, both hemispheres 62.4
2190 Female, age 85, both hemispheres 60.5
2804 Female, age 91, both hemispheres 55.9
2044 Male, age 76, both hemispheres 54.1
Lateral parabrachial nucleus
nTPM: 60.2
2792 Male, age 76, both hemispheres 68.3
2013 Male, age 80, both hemispheres 63.7
2790 Male, age 61, both hemispheres 63.4
2139 Female, age 85, right hemisphere 45.4
Lateral vestibular nucleus
nTPM: 59.7
2311 Male, age 80, both hemispheres 60.1
2184 Male, age 76, both hemispheres 59.3
Locus coeruleus
nTPM: 46.8
2720 Male, age 74, both hemispheres 55.3
2162 Male, age 80, both hemispheres 49.2
2788 Male, age 74, unknown 46.8
2317 Female, age 72, unknown 46.0
2014 Male, age 55, unknown 45.4
2123 Female, age 91, both hemispheres 43.0
1980 Male, age 76, both hemispheres 41.9
Medial olivary nucleus
nTPM: 66.8
1943 Male, age 61, both hemispheres 80.4
2851 Male, age 80, both hemispheres 64.1
1962 Male, age 76, both hemispheres 62.7
2138 Female, age 91, both hemispheres 60.0
Medial parabrachial nucleus
nTPM: 61.0
2463 Female, age 85, right hemisphere 67.6
2170 Female, age 91, both hemispheres 63.1
2156 Male, age 61, both hemispheres 58.9
2854 Male, age 80, both hemispheres 58.1
2786 Male, age 76, both hemispheres 57.4
Medial periolivary nuclei
nTPM: 55.2
2458 Female, age 91, both hemispheres 62.3
2081 Male, age 80, both hemispheres 61.7
2791 Male, age 74, right hemisphere 57.7
2063 Male, age 76, both hemispheres 48.8
2171 Female, age 85, both hemispheres 45.4
Medial vestibular nucleus
nTPM: 55.8
2801 Male, age 74, both hemispheres 61.6
2803 Female, age 91, both hemispheres 60.3
2093 Male, age 80, both hemispheres 59.2
2624 Male, age 61, both hemispheres 57.1
2743 Female, age 85, both hemispheres 49.4
2134 Male, age 76, both hemispheres 46.9
Motor facial nucleus
nTPM: 55.8
2126 Male, age 61, both hemispheres 67.6
2697 Female, age 85, both hemispheres 63.8
2365 Male, age 74, right hemisphere 55.8
2327 Male, age 80, both hemispheres 53.3
2795 Female, age 91, both hemispheres 51.1
2062 Male, age 76, both hemispheres 43.4
Motor hypoglossal nucleus
nTPM: 54.5
2182 Male, age 80, both hemispheres 63.9
2125 Female, age 91, both hemispheres 60.8
2132 Female, age 85, both hemispheres 57.7
2461 Male, age 61, both hemispheres 46.3
2277 Male, age 76, both hemispheres 43.7
Motor trigeminal nucleus
nTPM: 59.9
2321 Female, age 91, both hemispheres 65.6
2560 Male, age 74, both hemispheres 65.4
2309 Male, age 76, both hemispheres 57.8
2079 Male, age 80, both hemispheres 56.5
2335 Male, age 61, both hemispheres 54.1
Nuclei of the trapezoid body
nTPM: 52.0
2166 Male, age 80, both hemispheres 60.8
2368 Female, age 91, both hemispheres 57.6
2159 Male, age 61, both hemispheres 49.9
1983 Male, age 76, both hemispheres 48.9
2735 Female, age 85, both hemispheres 42.6
Nucleus ambiguus
nTPM: 64.1
2071 Male, age 76, both hemispheres 66.1
2096 Female, age 85, both hemispheres 62.0
Nucleus cuneatus
nTPM: 66.4
2380 Male, age 80, both hemispheres 74.8
2808 Female, age 85, both hemispheres 73.8
2100 Male, age 76, both hemispheres 69.6
2805 Female, age 91, both hemispheres 68.1
2564 Male, age 74, both hemispheres 61.0
2562 Male, age 61, both hemispheres 51.5
Nucleus gracilis
nTPM: 70.3
2382 Male, age 80, both hemispheres 79.2
2627 Male, age 74, both hemispheres 66.7
2299 Female, age 85, both hemispheres 65.0
Nucleus raphe magnus
nTPM: 50.1
2459 Female, age 91, both hemispheres 58.5
2328 Male, age 80, both hemispheres 56.2
2455 Male, age 74, both hemispheres 53.3
2051 Male, age 76, both hemispheres 51.0
2172 Female, age 85, both hemispheres 41.6
2160 Male, age 61, both hemispheres 40.1
Nucleus raphe obscurus
nTPM: 74.4
2800 Male, age 61, midline 77.8
2845 Female, age 85, midline 73.1
2142 Male, age 76, midline 72.4
Nucleus raphe pallidus
nTPM: 65.0
1924 Male, age 61, midline 69.1
2145 Male, age 76, midline 65.5
2183 Male, age 80, midline 60.4
Nucleus tractus solitarii
nTPM: 43.1
2307 Male, age 80, both hemispheres 48.3
2656 Male, age 76, both hemispheres 43.9
2191 Female, age 85, both hemispheres 43.0
2144 Female, age 91, right hemisphere 37.4
Paramedian reticular nucleus
nTPM: 55.0
2052 Male, age 76, both hemispheres 63.4
2057 Male, age 80, both hemispheres 56.5
2050 Female, age 85, both hemispheres 51.0
2313 Male, age 61, both hemispheres 49.1
Parvicellular reticular nuclei
nTPM: 59.8
2119 Male, age 80, both hemispheres 61.9
2095 Male, age 76, both hemispheres 58.9
2558 Male, age 74, both hemispheres 58.4
Parvicellular reticular nuclei, medullary
nTPM: 56.2
2091 Female, age 85, both hemispheres 58.5
2189 Female, age 91, both hemispheres 57.5
2181 Male, age 80, left hemisphere 52.7
Peritrigeminal nucleus
nTPM: 57.3
2179 Male, age 61, both hemispheres 60.0
2136 Male, age 76, both hemispheres 57.5
2067 Female, age 85, both hemispheres 54.3
Pontine nuclei
nTPM: 60.1
2319 Female, age 91, both hemispheres 75.6
2454 Male, age 74, left hemisphere 75.2
2115 Male, age 80, left hemisphere 65.7
2109 Female, age 72, unknown 59.6
1968 Male, age 76, left hemisphere 56.5
1863 Male, age 55, unknown 55.0
2787 Female, age 85, both hemispheres 46.7
2727 Male, age 61, right hemisphere 46.1
Pontine raphe nucleus
nTPM: 47.9
2853 Male, age 76, midline 49.4
2122 Female, age 85, midline 46.4
Posteroventral cochlear nucleus
nTPM: 66.3
2135 Female, age 91, both hemispheres 80.1
2341 Male, age 80, both hemispheres 74.9
2371 Male, age 61, both hemispheres 63.6
2070 Male, age 76, both hemispheres 62.0
2752 Female, age 85, both hemispheres 50.9
Prepositus hypoglossal nucleus
nTPM: 52.5
2855 Female, age 85, right hemisphere 57.5
2086 Male, age 80, both hemispheres 47.6
Principal sensory trigeminal nucleus
nTPM: 55.9
2367 Female, age 91, left hemisphere 69.2
2324 Male, age 76, both hemispheres 55.0
2008 Male, age 80, left hemisphere 51.2
2158 Male, age 61, both hemispheres 48.2
Reticular pontine nucleus, caudal
nTPM: 61.3
2559 Male, age 74, both hemispheres 72.7
2457 Female, age 91, both hemispheres 68.4
2092 Male, age 76, both hemispheres 55.6
2332 Male, age 80, right hemisphere 48.6
Reticular pontine nucleus, oral
nTPM: 66.3
2366 Female, age 91, both hemispheres 75.2
2361 Male, age 74, both hemispheres 70.8
1939 Male, age 80, both hemispheres 63.4
2167 Male, age 76, both hemispheres 63.2
2012 Female, age 85, both hemispheres 58.9
Reticulotegmental nucleus
nTPM: 55.4
2452 Male, age 74, both hemispheres 63.5
2322 Female, age 91, both hemispheres 59.9
2333 Male, age 80, both hemispheres 53.6
2325 Male, age 76, both hemispheres 44.7
Spinal trigeminal nucleus, caudal
nTPM: 62.6
2312 Male, age 61, both hemispheres 73.1
2308 Male, age 80, both hemispheres 64.0
2642 Male, age 74, both hemispheres 63.4
2390 Female, age 91, both hemispheres 57.4
2447 Male, age 76, both hemispheres 55.1
Spinal trigeminal nucleus, interpolar
nTPM: 52.9
2033 Male, age 80, both hemispheres 56.9
2389 Female, age 91, both hemispheres 55.5
2386 Female, age 85, both hemispheres 53.1
2625 Male, age 61, both hemispheres 49.9
2066 Male, age 76, right hemisphere 49.1
Spinal trigeminal nucleus, oral
nTPM: 57.0
2164 Male, age 80, both hemispheres 60.6
1978 Male, age 76, both hemispheres 57.1
2737 Female, age 85, both hemispheres 53.1
Spinal vestibular nucleus
nTPM: 61.7
2384 Male, age 74, both hemispheres 74.3
2748 Male, age 76, both hemispheres 65.4
2806 Female, age 85, both hemispheres 63.0
2186 Female, age 91, both hemispheres 60.3
2780 Male, age 80, both hemispheres 57.6
2796 Male, age 61, both hemispheres 49.4
Subcoeruleus area
nTPM: 59.0
2369 Female, age 85, left hemisphere 73.6
2451 Male, age 74, both hemispheres 64.3
2089 Male, age 76, left hemisphere 55.7
1958 Male, age 80, both hemispheres 51.5
2323 Female, age 91, left hemisphere 49.8
Superior olive
nTPM: 57.6
2329 Male, age 80, right hemisphere 60.7
2561 Female, age 91, both hemispheres 59.6
2020 Male, age 76, both hemispheres 59.5
2364 Male, age 74, right hemisphere 57.1
1875 Female, age 85, both hemispheres 51.1
Superior vestibular nucleus
nTPM: 52.7
2015 Male, age 80, both hemispheres 55.2
2383 Male, age 74, both hemispheres 52.3
2061 Male, age 76, both hemispheres 50.5
Ventral medullary reticular nucleus
nTPM: 68.4
2372 Male, age 61, both hemispheres 75.1
2060 Male, age 76, both hemispheres 61.8
Ventral periolivary nuclei
nTPM: 53.6
2023 Male, age 76, both hemispheres 59.7
2794 Female, age 91, left hemisphere 56.8
2165 Male, age 80, both hemispheres 51.2
2130 Female, age 85, both hemispheres 46.8
Ventrolateral medulla, A1-C1 cell groups
nTPM: 58.0
2118 Male, age 80, both hemispheres 67.2
2180 Male, age 61, both hemispheres 64.6
2302 Female, age 91, both hemispheres 54.5
1986 Male, age 76, both hemispheres 53.4
2741 Female, age 85, both hemispheres 50.1
Ventrolateral tegmental area, A5 NE cell group
nTPM: 61.0
2359 Male, age 61, both hemispheres 69.0
2456 Female, age 91, both hemispheres 66.6
2840 Female, age 85, both hemispheres 61.5
1959 Male, age 76, both hemispheres 57.5
2161 Male, age 80, both hemispheres 56.7
2449 Male, age 74, both hemispheres 55.0

PONS AND MEDULLA - FANTOM5 CAGEi

RNA expression in human tissues obtained through Cap Analysis of Gene Expression (CAGE) generated by the FANTOM5 project are reported as Scaled Tags Per Million.

Read more
Max Scaled Tags Per Million 84.6
FANTOM5 sample id Sample description Scaled Tags Per Million
Locus coeruleus
Scaled Tags Per Million: 81.6
FF:10182-103D2 60 years, female 81.7
FF:10165-103B3 76 years, female 81.4
Medulla oblongata
Scaled Tags Per Million: 78.5
FF:10038-101F2 18-64 years, mixed 94.5
FF:10174-103C3 60 years, female 83.1
FF:10155-103A2 76 years, female 57.7
Pons
Scaled Tags Per Million: 84.6
FF:10033-101E6 18-54 years, mixed 84.6

PONS AND MEDULLA - Pig RNA-seqi

RNA-seq data obtained from pig brain is reported as nTPM .

Normal distribution across the dataset is visualized with box plots, shown as median and 25th and 75th percentiles. Points are displayed as outliers if they are above or below 1.5 times the interquartile range. nTPM values of the individual samples are presented next to the box plot.
Read more
Average nTPM 4.4
Pig sample Sample description nTPM
Medulla oblongata
nTPM: 4.3
Samples: 4

Max nTPM: 4.6
Min nTPM: 4.0
Sample A Female 4.3
Sample B Female 4.3
Sample C Male 4.0
Sample D Male 4.6
Pons
nTPM: 4.4
Samples: 4

Max nTPM: 5.0
Min nTPM: 3.8
Sample A Female 4.5
Sample B Female 5.0
Sample C Male 3.8
Sample D Male 4.2

PONS AND MEDULLA - Mouse RNA-seqi

RNA-seq data obtained from mouse brain is reported as nTPM .

Normal distribution across the dataset is visualized with box plots, shown as median and 25th and 75th percentiles. Points are displayed as outliers if they are above or below 1.5 times the interquartile range. nTPM values of the individual samples are presented next to the box plot.
Read more
Average nTPM 2.1
Mouse sample Sample description nTPM
Pons and medulla
nTPM: 2.1
Samples: 4

Max nTPM: 2.5
Min nTPM: 1.8
Sample A Male 2.3
Sample B Male 2.5
Sample C Female 1.8
Sample D Female 1.9

Contact

  • NEWS ARTICLES
  • PRESS ROOM
  • contact@proteinatlas.org

The Project

  • INTRODUCTION
  • ORGANIZATION
  • PUBLICATIONS

The Human Protein Atlas

  • DOWNLOADABLE DATA
  • LICENCE & CITATION
  • HELP & FAQ
The Human Protein Atlas project is funded
by the Knut & Alice Wallenberg Foundation.