Search result
SUMMARY

TISSUE
BRAIN
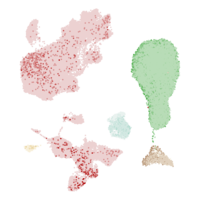
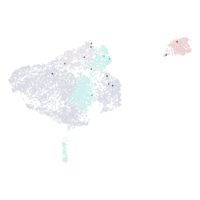
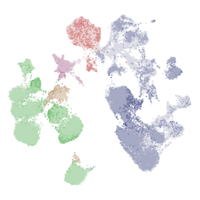
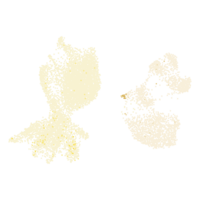
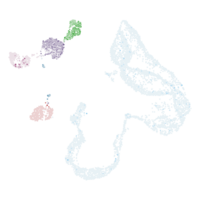
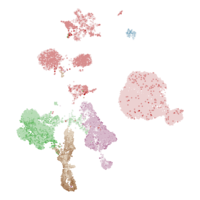
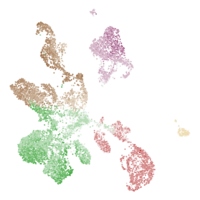
SINGLE CELL
TISSUE CELL
PATHOLOGY
DISEASE
IMMUNE
BLOOD

SUBCELL
CELL LINE
STRUCTURE
|
||||||||||||||||||||||||||||||||||||||||||||||||||||||||||||||||||||||||||||||||||||||||||||||||||||||
| Adipocytes | 708.6 nTPM |
| Adipose tissue | 959.4 nTPM |
| Breast | 457.9 nTPM |
| Alveolar cells type 1 | 65.0 nTPM |
| Lung | 65.0 nTPM |
| Alveolar cells type 2 | 887.1 nTPM |
| Lung | 887.1 nTPM |
| Astrocytes | 0.0 nTPM |
| Brain | 0.0 nTPM |
| B-cells | 17.5 nTPM |
| Skin | 126.2 nTPM |
| Thymus | 41.4 nTPM |
| Adipose tissue | 40.1 nTPM |
| Lung | 10.8 nTPM |
| Esophagus | 6.0 nTPM |
| Salivary gland | 1.9 nTPM |
| Lymph node | 0.9 nTPM |
| Kidney | 0.0 nTPM |
| Liver | 0.0 nTPM |
| PBMC | 0.0 nTPM |
| Bone marrow | 0.0 nTPM |
| Spleen | 0.0 nTPM |
| Stomach | 0.0 nTPM |
| Basal prostatic cells | 21.8 nTPM |
| Prostate | 21.8 nTPM |
| Basal respiratory cells | 1.4 nTPM |
| Bronchus | 1.4 nTPM |
| Basal squamous epithelial cells | 4.7 nTPM |
| Esophagus | 4.7 nTPM |
| Bipolar cells | 16.3 nTPM |
| Eye | 16.3 nTPM |
| Breast glandular cells | 8.1 nTPM |
| Breast | 8.1 nTPM |
| Breast myoepithelial cells | 14.1 nTPM |
| Breast | 14.1 nTPM |
| Cardiomyocytes | 8.3 nTPM |
| Heart muscle | 8.3 nTPM |
| Cholangiocytes | 0.0 nTPM |
| Liver | 0.0 nTPM |
| Collecting duct cells | 3.9 nTPM |
| Kidney | 3.9 nTPM |
| Cone photoreceptor cells | 0.0 nTPM |
| Eye | 0.0 nTPM |
| Cytotrophoblasts | 0.8 nTPM |
| Placenta | 0.8 nTPM |
| Dendritic cells | 1.2 nTPM |
| Adipose tissue | 2.5 nTPM |
| PBMC | 0.0 nTPM |
| Distal tubular cells | 0.0 nTPM |
| Kidney | 0.0 nTPM |
| Ductal cells | 4.5 nTPM |
| Pancreas | 4.5 nTPM |
| Early spermatids | 2.4 nTPM |
| Testis | 2.4 nTPM |
| Endometrial ciliated cells | 38.0 nTPM |
| Endometrium | 38.0 nTPM |
| Endometrial stromal cells | 925.9 nTPM |
| Endometrium | 925.9 nTPM |
| Endothelial cells | 214.4 nTPM |
| Prostate | 620.6 nTPM |
| Vascular | 589.5 nTPM |
| Skeletal muscle | 557.1 nTPM |
| Thymus | 517.7 nTPM |
| Salivary gland | 291.0 nTPM |
| Tongue | 174.7 nTPM |
| Skin | 158.3 nTPM |
| Lung | 152.8 nTPM |
| Endometrium | 144.9 nTPM |
| Ovary | 139.1 nTPM |
| Liver | 87.2 nTPM |
| Esophagus | 51.4 nTPM |
| Breast | 49.9 nTPM |
| Heart muscle | 39.1 nTPM |
| Placenta | 33.9 nTPM |
| Pancreas | 20.9 nTPM |
| Testis | 17.3 nTPM |
| Enteroendocrine cells | 0.8 nTPM |
| Rectum | 1.7 nTPM |
| Colon | 0.7 nTPM |
| Small intestine | 0.0 nTPM |
| Erythroid cells | 0.4 nTPM |
| Bone marrow | 0.8 nTPM |
| Liver | 0.0 nTPM |
| Excitatory neurons | 0.0 nTPM |
| Brain | 0.0 nTPM |
| Exocrine glandular cells | 3.5 nTPM |
| Pancreas | 3.5 nTPM |
| Extravillous trophoblasts | 2.4 nTPM |
| Placenta | 2.4 nTPM |
| Fibroblasts | 553.4 nTPM |
| Adipose tissue | 1810.7 nTPM |
| Lung | 1616.6 nTPM |
| Thymus | 1387.5 nTPM |
| Vascular | 895.8 nTPM |
| Skin | 716.3 nTPM |
| Stomach | 691.8 nTPM |
| Skeletal muscle | 373.5 nTPM |
| Prostate | 372.3 nTPM |
| Ovary | 320.3 nTPM |
| Salivary gland | 266.2 nTPM |
| Liver | 120.3 nTPM |
| Breast | 85.2 nTPM |
| Esophagus | 78.8 nTPM |
| Heart muscle | 55.5 nTPM |
| Pancreas | 46.9 nTPM |
| Placenta | 17.0 nTPM |
| Gastric mucus-secreting cells | 4.2 nTPM |
| Stomach | 4.2 nTPM |
| Glandular and luminal cells | 224.0 nTPM |
| Endometrium | 224.0 nTPM |
| Granulosa cells | 913.5 nTPM |
| Ovary | 913.5 nTPM |
| Hepatocytes | 6.4 nTPM |
| Liver | 6.4 nTPM |
| Hofbauer cells | 2.9 nTPM |
| Placenta | 2.9 nTPM |
| Horizontal cells | 23.1 nTPM |
| Eye | 23.1 nTPM |
| Inhibitory neurons | 0.0 nTPM |
| Brain | 0.0 nTPM |
| Intestinal goblet cells | 0.2 nTPM |
| Colon | 0.7 nTPM |
| Small intestine | 0.0 nTPM |
| Rectum | 0.0 nTPM |
| Ionocytes | 0.7 nTPM |
| Bronchus | 0.7 nTPM |
| Kupffer cells | 7.8 nTPM |
| Liver | 7.8 nTPM |
| Langerhans cells | 98.4 nTPM |
| Skin | 98.4 nTPM |
| Late spermatids | 8.2 nTPM |
| Testis | 8.2 nTPM |
| Leydig cells | 199.2 nTPM |
| Testis | 199.2 nTPM |
| Macrophages | 29.7 nTPM |
| Thymus | 102.1 nTPM |
| Vascular | 97.8 nTPM |
| Skeletal muscle | 57.9 nTPM |
| Breast | 52.9 nTPM |
| Endometrium | 51.4 nTPM |
| Skin | 48.5 nTPM |
| Adipose tissue | 46.0 nTPM |
| Stomach | 44.4 nTPM |
| Ovary | 33.9 nTPM |
| Spleen | 18.3 nTPM |
| Prostate | 17.3 nTPM |
| Liver | 15.0 nTPM |
| Tongue | 13.3 nTPM |
| Lung | 7.9 nTPM |
| Salivary gland | 7.3 nTPM |
| Esophagus | 3.9 nTPM |
| Bone marrow | 3.1 nTPM |
| Testis | 2.5 nTPM |
| PBMC | 0.3 nTPM |
| Kidney | 0.0 nTPM |
| Pancreas | 0.0 nTPM |
| Melanocytes | 97.5 nTPM |
| Skin | 97.5 nTPM |
| Microglial cells | 0.0 nTPM |
| Brain | 0.0 nTPM |
| Monocytes | 38.7 nTPM |
| Adipose tissue | 77.5 nTPM |
| PBMC | 0.0 nTPM |
| Mucus glandular cells | 215.2 nTPM |
| Salivary gland | 215.2 nTPM |
| Muller glia cells | 90.3 nTPM |
| Eye | 90.3 nTPM |
| Nk-cells | 4.4 nTPM |
| Adipose tissue | 8.8 nTPM |
| PBMC | 0.0 nTPM |
| Oligodendrocyte precursor cells | 0.0 nTPM |
| Brain | 0.0 nTPM |
| Oligodendrocytes | 0.0 nTPM |
| Brain | 0.0 nTPM |
| Pancreatic endocrine cells | 6.9 nTPM |
| Pancreas | 6.9 nTPM |
| Paneth cells | 0.0 nTPM |
| Colon | 0.0 nTPM |
| Small intestine | 0.0 nTPM |
| Rectum | 0.0 nTPM |
| Peritubular cells | 416.8 nTPM |
| Testis | 416.8 nTPM |
| Plasma cells | 13.5 nTPM |
| Thymus | 39.5 nTPM |
| Salivary gland | 37.2 nTPM |
| Esophagus | 15.8 nTPM |
| Liver | 1.5 nTPM |
| Stomach | 0.4 nTPM |
| Bone marrow | 0.0 nTPM |
| Spleen | 0.0 nTPM |
| Prostatic glandular cells | 8.2 nTPM |
| Prostate | 8.2 nTPM |
| Proximal enterocytes | 0.1 nTPM |
| Small intestine | 0.1 nTPM |
| Proximal tubular cells | 0.0 nTPM |
| Kidney | 0.0 nTPM |
| Rod photoreceptor cells | 4.4 nTPM |
| Eye | 4.4 nTPM |
| Salivary duct cells | 58.5 nTPM |
| Salivary gland | 58.5 nTPM |
| Schwann cells | 20.1 nTPM |
| Vascular | 48.9 nTPM |
| Adipose tissue | 11.5 nTPM |
| Esophagus | 0.0 nTPM |
| Serous glandular cells | 15.6 nTPM |
| Salivary gland | 17.7 nTPM |
| Tongue | 13.4 nTPM |
| Sertoli cells | 185.2 nTPM |
| Testis | 185.2 nTPM |
| Skeletal myocytes | 113.8 nTPM |
| Skeletal muscle | 113.8 nTPM |
| Smooth muscle cells | 1776.9 nTPM |
| Thymus | 5362.2 nTPM |
| Prostate | 3845.8 nTPM |
| Skin | 3608.1 nTPM |
| Lung | 2675.7 nTPM |
| Vascular | 2593.2 nTPM |
| Breast | 2268.4 nTPM |
| Adipose tissue | 2053.4 nTPM |
| Skeletal muscle | 1704.7 nTPM |
| Ovary | 1594.2 nTPM |
| Salivary gland | 1360.4 nTPM |
| Tongue | 1241.9 nTPM |
| Endometrium | 889.6 nTPM |
| Esophagus | 578.1 nTPM |
| Liver | 193.2 nTPM |
| Placenta | 133.5 nTPM |
| Heart muscle | 105.6 nTPM |
| Bronchus | 0.0 nTPM |
| Spermatocytes | 1.0 nTPM |
| Testis | 1.0 nTPM |
| Spermatogonia | 1.2 nTPM |
| Testis | 1.2 nTPM |
| Squamous epithelial cells | 5.6 nTPM |
| Esophagus | 5.6 nTPM |
| Syncytiotrophoblasts | 2.2 nTPM |
| Placenta | 2.2 nTPM |
| T-cells | 12.3 nTPM |
| Vascular | 74.0 nTPM |
| Endometrium | 51.9 nTPM |
| Skin | 47.5 nTPM |
| Breast | 14.2 nTPM |
| Adipose tissue | 13.8 nTPM |
| Skeletal muscle | 10.3 nTPM |
| Lung | 9.4 nTPM |
| Prostate | 9.2 nTPM |
| Esophagus | 4.9 nTPM |
| Salivary gland | 4.5 nTPM |
| Thymus | 4.5 nTPM |
| Placenta | 4.1 nTPM |
| Tongue | 3.7 nTPM |
| Liver | 2.2 nTPM |
| Colon | 2.0 nTPM |
| Stomach | 1.7 nTPM |
| Spleen | 0.8 nTPM |
| Lymph node | 0.3 nTPM |
| PBMC | 0.1 nTPM |
| Kidney | 0.0 nTPM |
| Bone marrow | 0.0 nTPM |
| Theca cells | 394.3 nTPM |
| Ovary | 394.3 nTPM |
| Thymic epithelial cells | 87.1 nTPM |
| Thymus | 87.1 nTPM |
| Undifferentiated cells | 0.2 nTPM |
| Colon | 0.4 nTPM |
| Rectum | 0.2 nTPM |
| Small intestine | 0.1 nTPM |
The Project
The Human Protein Atlas
 The Human Protein Atlas project is funded